데이터분석 2주차 강의 노트정리 [국비지원_스파르타 코딩클럽]
스파르타 코딩클럽 데이터분석 2주차 강의 '핵심' 노트정리

1. Pandas 기초
: Pandas의 DataFrame과 친해지기
1-1) Pandas, Numpy 라이브러리, 라이브러리 import하기
!pip install pandas numpyimport pandas as pd
import numpy as np
1-2) 기본 DataFrame 만들기
① DataFrame 이해하기
data = {
    'name':['철수','영희','동희','영수'],
    'age':[15,12,20,35]
}

df = pd.DataFrame(data)

df

② df 행 추가하기(append 하기)
: ignore_index는 index를 따로 안 넣고 그냥 0,1,2,3,4로 붙겠다는 의미
doc = {
   'name' :'지민',
   'age' : 22
}

df.append(doc,ignore_index = True)

③ df 열 추가하기

<첫 번째> : 특정 열만 뽑아보기
※ 대괄호를 두 번 해야 DataFrame 형식으로 반환됨.
df['city'] = ['서울','부산','서울','부산','부산']

df[['name','city']]
<두 번째> : 원하는 조건에 맞는 행만 뽑아보기
df['city'] = ['서울','부산','서울','부산','부산']

cond = df['age'] < 20
df[cond]
df['city'] = ['서울','부산','서울','부산','부산']
df[df['age'] < 20]
<세 번째> : 특정 행에서 데이터 뽑아보기
: 데이터를 정렬한 뒤에 처음과 마지막 데이터에 접근할 때 자주 사용!
df.iloc[-1]   #마지막 줄을 가져옴
df.iloc[-1,0]  #마지막 줄의 0번째 정보 = 이름
df.iloc[-2,3]  #마지막에서 두 번째 줄의 3번째 정보 = 도시
④ df 연산

<첫 번째> : 열 정렬하기
df.sort_values(by='age', ascending=True)df.sort_values(by='age', ascending = False).iloc[0,1]
<두 번째> : 조건에 맞는 열 추가하기
: 조건에 맞는 데이터를 넣을 때 np를 씀
df['is_adult'] = np.where(df['age'] < 20, '청소년','성인')

df
<세 번째> : 평균, 최대,최소값, 개수, describe 구하기
df['age'].mean()

df['age'].max()

df['age'].min()

df['age'].count()

df['age'].describe()
ex. 서울에 사는 사람들의 나이 평균은?
df[df['city'] == '서울']['age'].mean()
2. 엑셀 다운 받기
: 엑셀파일 하나를 다운받고, 이 자료를 import해서 내 입맛에 맞는 종목 찾아보기
▶ 종목데이터 코드스니펫
https://s3.ap-northeast-2.amazonaws.com/materials.spartacodingclub.kr/automation/week02/%EC%A2%85%EB%AA%A9%EB%8D%B0%EC%9D%B4%ED%84%B0.xlsx
① 새 창에 위 종목데이터 코드스니펫을 입력하면 파일 하나가 다운받아짐.

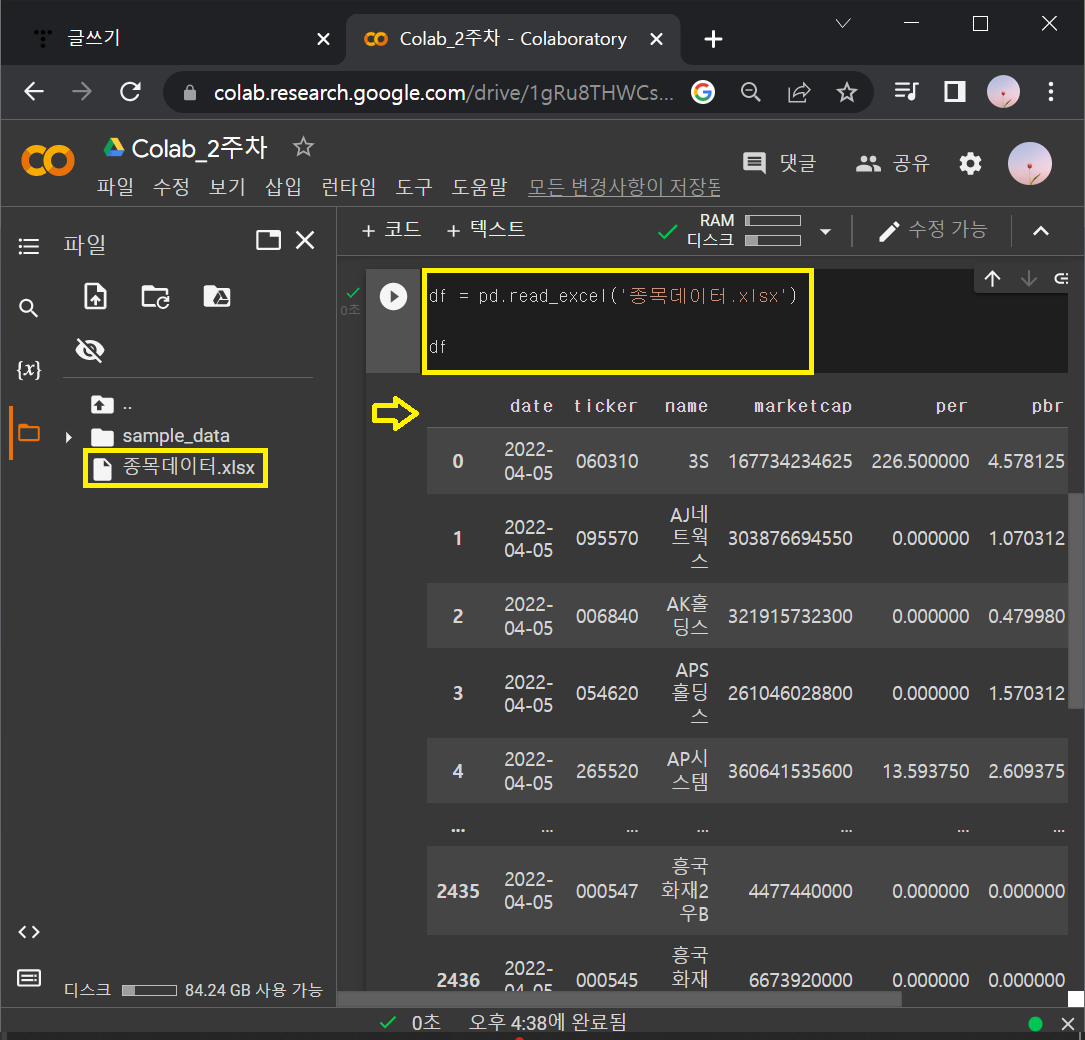
② 다운로드 된 파일을 드래그해서 colab [파일]에 업로드한 뒤에 엑셀파일 읽어오기
df = pd.read_excel('종목데이터.xlsx')

df #여기에 .head()를 덧붙이면 맨 위 5개 데이터를 보여주고
   #       .tail()를 덧붙이면 맨 아래 5개 데이터를 보여줌.
   #       () 안에 숫자를 적으면 그 숫자 개수대로 데이터를 보여줌.
▶ 소수점 둘째자리 코드스니펫
pd.options.display.float_format = '{:.2f}'.format
3. Pandas 실전
ex 1. 어제 오른 종목들만 골라보기 (change_rate가 0보다 큰 종목)
df['change_rate'] > 0

df[cond]
ex 2. per가 0인 종목들 제거하기
: ex1번의 df[cond] → df = df [cond]로 바꿔서 새로운 df로 저장. + per가 0보다 크다는 조건 추가하기
cond = df['per'] > 0
df = df[cond]

df
ex 3. 종가(close), 순이익(earning) 추가하기
* per = 시가총액(marketcap) / 순이익(earning) = 주가 / 주당순이익(eps)
df['close'] = df['per'] * df['eps']
df['earning'] = df['marketcap'] / df['per']

ex 4. date 컬럼 없애기
del df['date']
ex 5. pbr < 1 & 시가총액 1조 이상 & per < 20을 추려보기
cond = (df['pbr'] < 1) & (df['marketcap'] > 1000000000000) & (df['per'] <20)
df = df[cond]
+ 시가총액(marketcap) 기준으로 내림차순 정렬하기
df.sort_values(by='marketcap', ascending = False)
+ df.describe() 도 해보기
4. 해외주식 다루기_ yfinance 기초
♣ yfinance 전체 사용법을 둘러보고 싶으면 → https://pypi.org/project/yfinance/
4-0) yfinance 라이브러리, 라이브러리 import 하기
!pip install yfinanceimport yfinance as yf
4-1) 기초정보 얻기
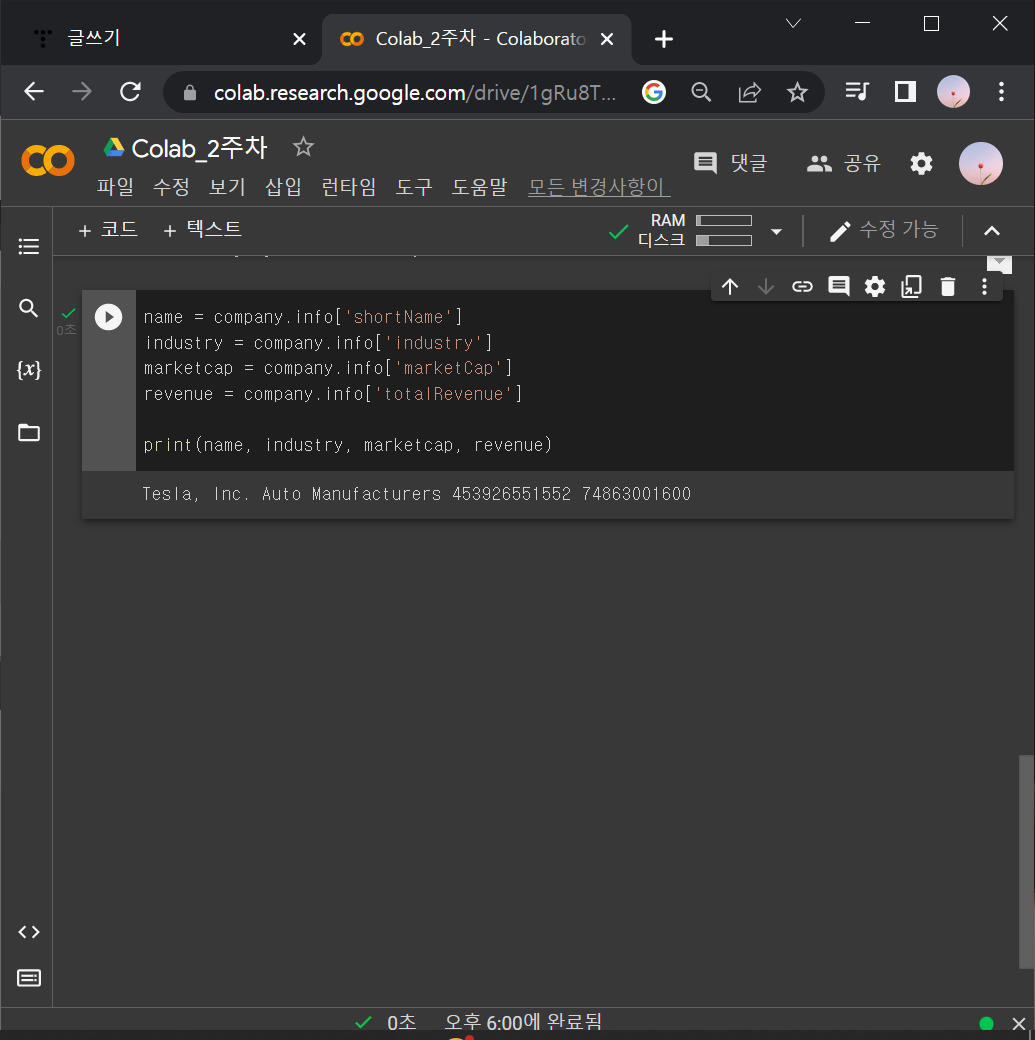
① 회사명(shortName), 산업(industry), 시가총액(marketCap), 매출(totalRevenue)
name = company.info['shortName']
industry = company.info['industry']
marketcap = company.info['marketCap']
revenue = company.info['totalRevenue']

print(name, industry, marketcap, revenue)
② 대차대조표, 현금흐름표, 기업실적
company.balance_sheet
company.balance_sheet.loc[['Cash And Cash Equivalents']]

company.cashflow

company.earnings
③ 그 외 정보들 (주주정보, 애널리스트 추천 등)
company.institutional_holders

company.recommendations

company.calendar
# JP Morgan 것만 보고 싶을 때
df = company.recommendations
cond = df['Firm'] == 'JP Morgan'
df[cond]# news 제목만 모아보기
news = company.news
for n in news:
print(n['title'])
5. 분석하기(1)_ 전략세우기
♥ 분석과정: 1. 전략 세우기 → 2. 데이터 모으기 → 3. 모아진 데이터 분석하기
5-1) 전략세우기
: 종목 별로 보고싶은 정보 모아보기
(ex. 종목코드, 회사명, 산업, 짧은 설명, 시가총액, 현재주가, 1년 후 예상주가, PER, EPS, PBR)
company = yf.Ticker('TSLA')

code = 'TSLA'
name = company.info['shortName']
industry = company.info['industry']
marketcap = company.info['marketCap']
summary = company.info['longBusinessSummary']
currentprice = company.info['currentPrice']
targetprice = company.info['targetMeanPrice']

per = company.info['trailingPE']
eps = company.info['trailingEps']
pbr = company.info['priceToBook']

print(code,name,industry,marketcap,summary,currentprice,targetprice,per,eps,pbr)

+ 매출, 순이익 정보
rev2021 = company.earnings.iloc[-1,0]
rev2020 = company.earnings.iloc[-2,0]
rev2019 = company.earnings.iloc[-3,0]

ear2021 = company.earnings.iloc[-1,1]
ear2020 = company.earnings.iloc[-2,1]
ear2019 = company.earnings.iloc[-3,1]
5-2) 데이터 모으기
: 데이터를 모아서 표로 만들기
5-2-0) 빈 DataFrame 만들기
import pandas as pd

df = pd.DataFrame()
5-2-1) DataFrame에 데이터 넣는법 간단하게 복습
▶ 딕셔너리 변환 코드스니펫
df.append(doc,ignore_index = True)
doc = {
	'name':'bob',
	'age':26,
}
df.append(doc,ignore_index=True)
5-2-2) 전체 데이터 모으기
def add_company(code) :
  company = yf.Ticker(code)

  name = company.info['shortName']
  industry = company.info['industry']
  marketcap = company.info['marketCap']
  summary = company.info['longBusinessSummary']
  currentprice = company.info['currentPrice']
  targetprice = company.info['targetMeanPrice']

  per = company.info['trailingPE']
  eps = company.info['trailingEps']
  pbr = company.info['priceToBook']

  rev2021 = company.earnings.iloc[-1,0]
  rev2020 = company.earnings.iloc[-2,0]
  rev2019 = company.earnings.iloc[-3,0]

  ear2021 = company.earnings.iloc[-1,1]
  ear2020 = company.earnings.iloc[-2,1]
  ear2019 = company.earnings.iloc[-3,1]

  doc = {
      'name' : name,
      'industry' : industry,
      ' marketcap' :  marketcap,
      'summary' : summary,
      'currentprice' : currentprice,
      'targetprice' : targetprice,
      'per' : per,
      'eps' : eps,
      'pbr' : pbr,
      'rev2021' : rev2021,
      'rev2020' : rev2020,
      'rev2019' : rev2019,
      'ear2021' : ear2021,
      'ear2020' : ear2020,
      'ear2019' : ear2019
  }

  return doc
5-2-3) 10개 회사에 대한 전체 데이터 모으기
df = pd.DataFrame()

codes = ['AAPL','ABNB','BIDU','FB','GOOG','MSFT','TSLA','PYPL','NFLX','NVDA']

for code in codes :
  print(code)
  row = add_company(code)
  df = df.append(row, ignore_index = True)

df

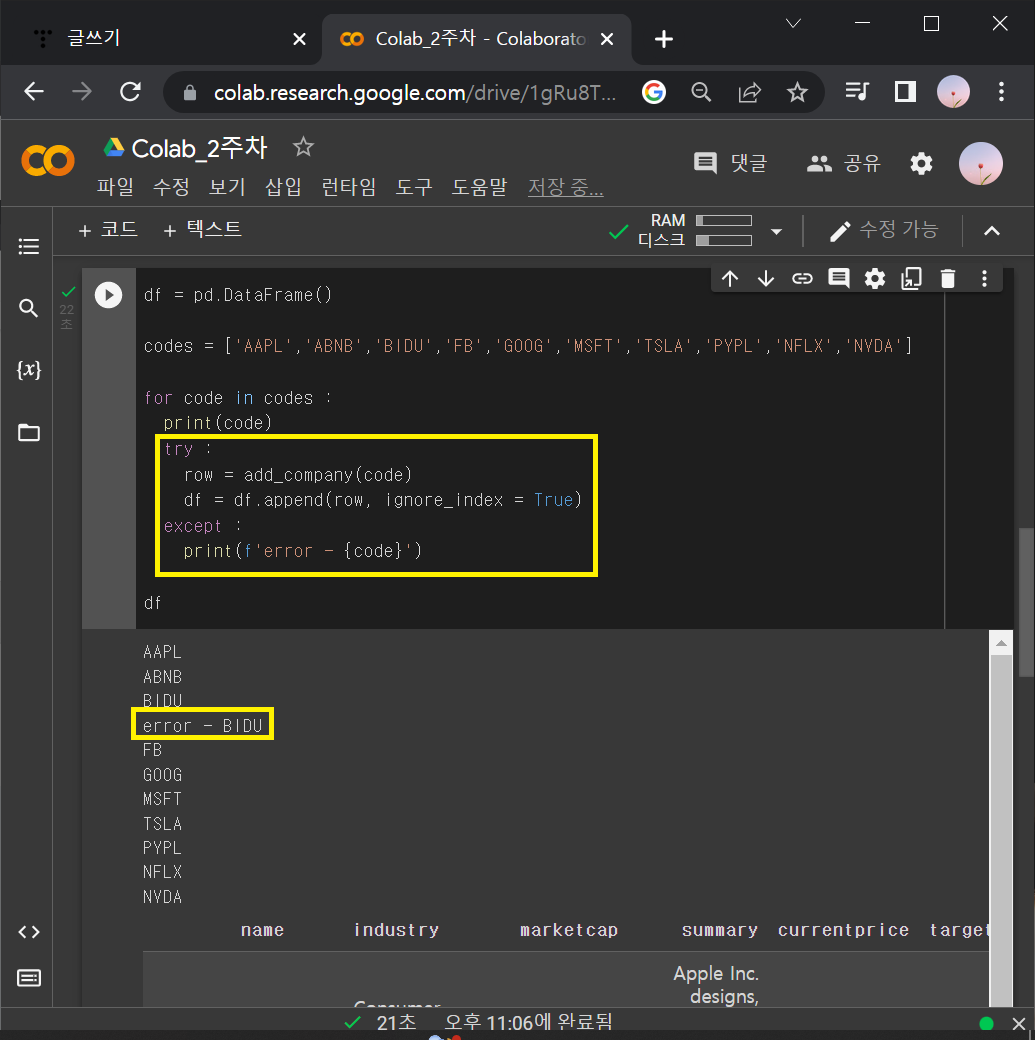
: 여기서 Ctrl + Enter를 치면 에러가 뜸.
(어떤 회사는 5-2-2에 나열한 항목 중 몇에 대한 데이터가 존재하지 않기 때문)
→ 이 때는 try : ~ except: 를 써서 빈칸 때문에 에러가 나도 넘어가게끔 해주기
df = pd.DataFrame()

codes = ['AAPL','ABNB','BIDU','FB','GOOG','MSFT','TSLA','PYPL','NFLX','NVDA']

for code in codes :
  print(code)
  try :
    row = add_company(code)
    df = df.append(row, ignore_index = True)
  except :
    print(f'error - {code}')

df
5-3) 모아진 데이터 분석하기
문제1) eps 순서대로 정렬해보기
df.sort_values(by = 'eps', ascending = False)

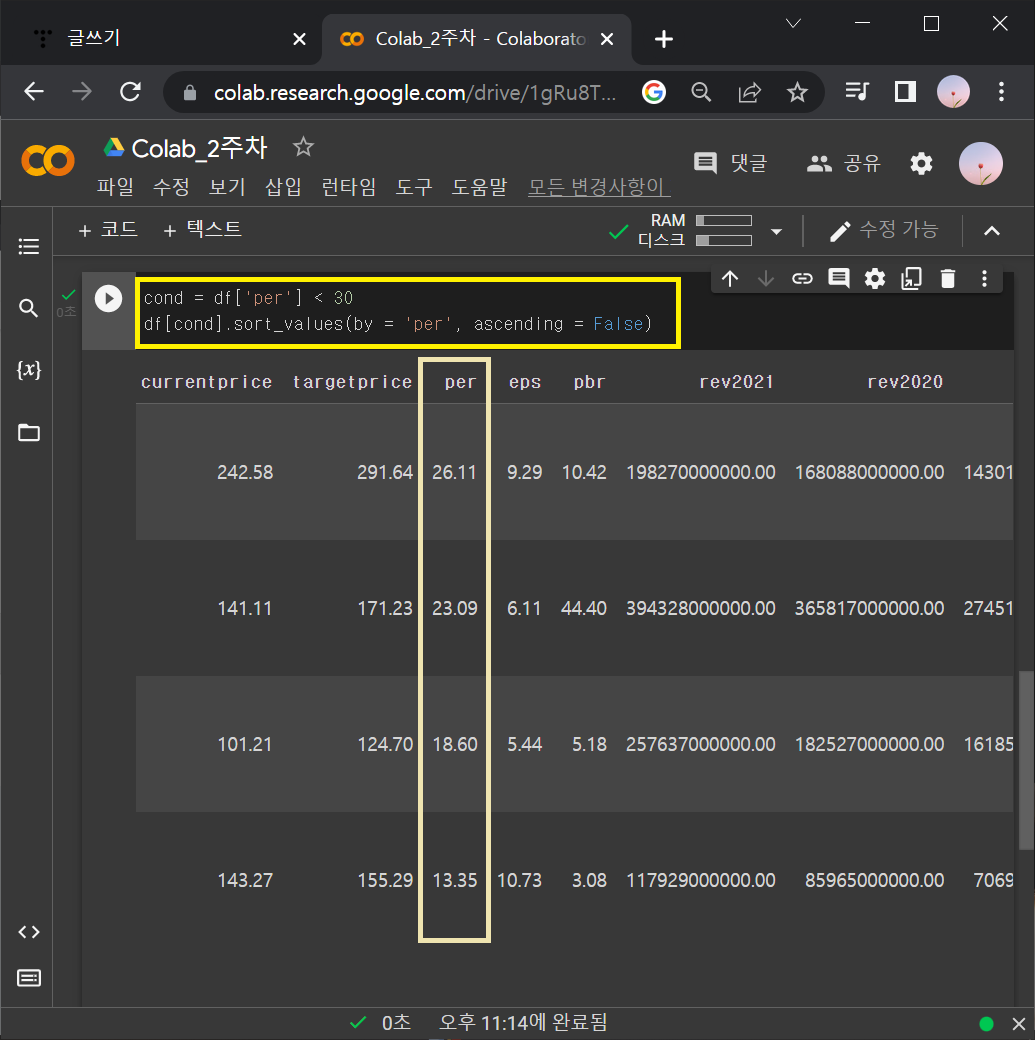
문제2) per 가 30 이하인 것만 보기
cond = df['per'] < 30
df[cond].sort_values(by = 'per', ascending = False)
문제3) 현재가격과 1년 후 가격의 비율 차이가 큰 종목들 추려내기
new_df = df[['name','currentprice','targetprice']].copy()

new_df['gap'] = new_df['targetprice'] / new_df['currentprice'] -1

new_df.sort_values(by = 'gap', ascneding = False)
: df[['name','currentprice','targetprice']]로 new_df를 만들었는데
이걸 바꾸고 조작하게 되면 원본에 영향이 감. 그래서 오류가 뜸.
→ .copy() 를 써야 원본에 영향이 안 가는 새로운 걸 만들어줌.
문제4) 3년 연속 순수익(earning)이 오른 기업 O,X로 표기하기
① 3년 연속 순수익이 오른 기업 출력해보기
new_df = df[['name','ear2021','ear2020','ear2019']].copy

cond = (new_df['ear2021'] > new_df['ear2020']) & (new_df['ear2020'] >new_df['ear2019'])

new_df[cond]
② 옆에 새로운 열을 만들고, O,X 표기까지 해보기
new_df = df[['name','ear2021','ear2020','ear2019']].copy

cond = (new_df['ear2021'] > new_df['ear2020']) & (new_df['ear2020'] >new_df['ear2019'])

new_df['is_target'] = np.where(cond,'O','X')

new_df